

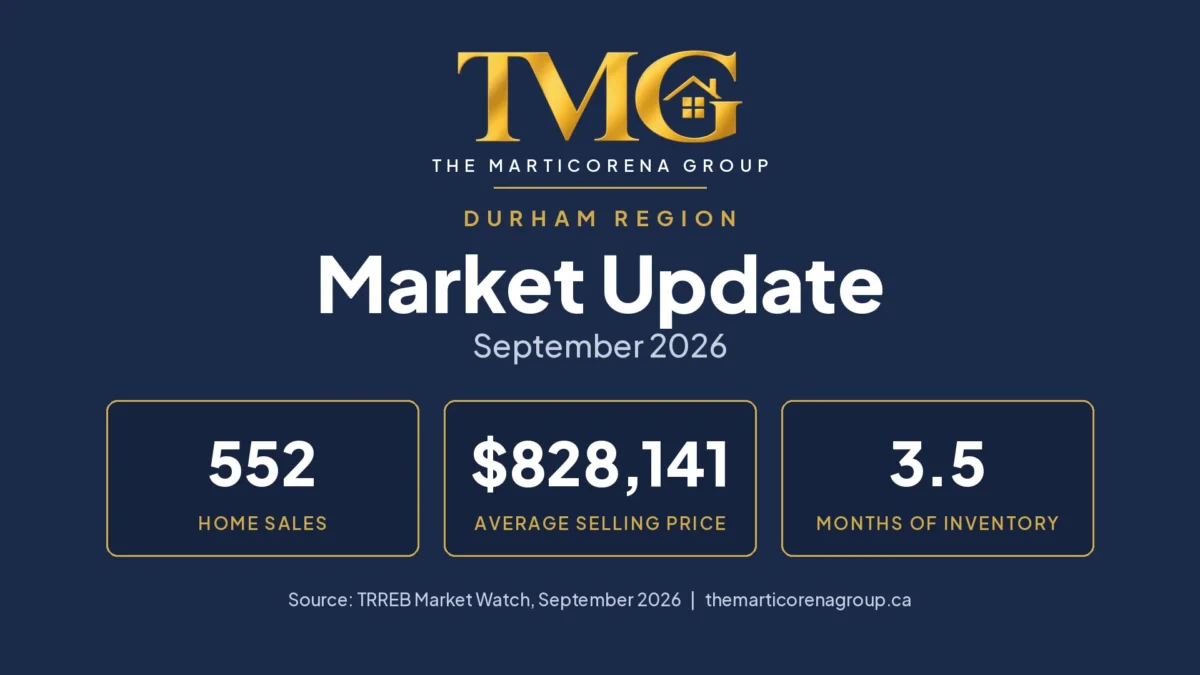
Monthly Market Update · Durham Region and its communities · Source: TRREB Market Watch, September 2026
Durham’s fall market opened more quietly than last year, and the reason matters more than the headline.
In September, 552 homes sold across Durham Region, about 22% fewer than last September. New listings fell too, to 1,834, but by much less: about 12%.
When sales fall faster than new supply, the balance shifts. Durham’s months of inventory, a measure of how much choice buyers have, rose from 3.1 last September to 3.5.
In plain language: conditions moved somewhat toward buyers. There was generally more choice and less competition for each home than a year ago.
TMG Takeaway: what September is telling us
Sales fell much more than new listings did, so buyers have more choice than they had last September.
Prices are about 5 to 6% lower than a year ago.
The homes that did sell still went for about 98% of their asking price, on average.
Put together: this is a slower market, not a deeply discounted one. Price, property type, condition and location still decide how an individual home does.
The numbers behind the story
Here is September next to the same month last year. We compare with the same month a year earlier because real estate is seasonal, so September against September is the fairest comparison.
| September 2026 | September 2025 | What changed | |
|---|---|---|---|
| Homes sold | 552 | 707 | About 22% fewer |
| New listings | 1,834 | 2,082 | About 12% fewer |
| Homes for sale at month end | 2,622 | 2,810 | About 7% fewer |
| Average selling price | $828,141 | $877,963 | About 6% lower |
| Months of inventory | 3.5 | 3.1 | More choice for buyers |
| Sold price vs. asking price | 98% | 98% | No change |
Source: TRREB Market Watch, September 2026 and September 2025. Percentages are calculated by The Marticorena Group from the figures as originally published.
A few of these numbers need a plain-English explanation to be useful.
What “3.5 months of inventory” means
Months of inventory is an estimate of how long it would take to sell all the homes currently for sale, at the current pace of sales, if no new homes were listed.
Durham is at 3.5 months. Last September it was 3.1.
The higher the number, the more homes buyers have to compare and, potentially, the more room they have to negotiate. The lower the number, the more buyers compete with each other. So 3.5 against 3.1 tells us the balance moved a little toward buyers. It is still tighter than the GTA as a whole, which sits at 4.6.
What it does not mean: that every seller has to discount. This is one number for the whole region. Conditions differ by community, neighbourhood, home type, price range, condition and how many similar homes are for sale nearby.
What “98% of asking” does and does not tell us
Homes that sold in September went for about 98% of their asking price on average, the same as a year ago.
That is useful context: buyers have more choice, but sellers of homes that sold were not giving up large amounts.
It has limits, though. It does not mean:
- that every listing sold. It only counts the homes that did.
- that every seller received 98% of their original asking price. Prices can be reduced, or a home relisted, before it sells.
- that buyers can only negotiate 2%. It is an average across very different homes.
Why you see two different “days on market” numbers
TRREB publishes two, and they measure different things.
Listing days on market counts only the listing that sold. For Durham in September, that was 30 days.
Property days on market also counts earlier listings of the same home by the same seller and brokerage, for example when a home is taken off the market and relisted. That was 48 days, up slightly from 46 last September.
We use the second number when we talk about how long homes are spending on the market, because it is closer to the full picture. Neither one is guaranteed to capture a home’s complete history, so for any individual property the actual listing record is what counts.
How Durham’s communities compare
Durham is not one market. Here is how the five larger communities looked in September.
Average price and benchmark price: why we use both
You will see two kinds of prices in market reports, and they can move differently without contradicting each other.
The average selling price is simply the average of the homes that happened to sell that month. If a few more large detached homes sell, or a few more condos, the average moves even when home values have not.
The benchmark price is TRREB’s estimate of what a typical home in a community is worth, based on its features. Because it is not thrown off by which homes happened to sell, it is the better guide to how values are moving over time.
Durham’s average selling price is about 6% lower than last September and its benchmark is 5.2% lower. Both point the same way. In some communities the two move by different amounts. That does not make either number wrong; they are measuring different things.
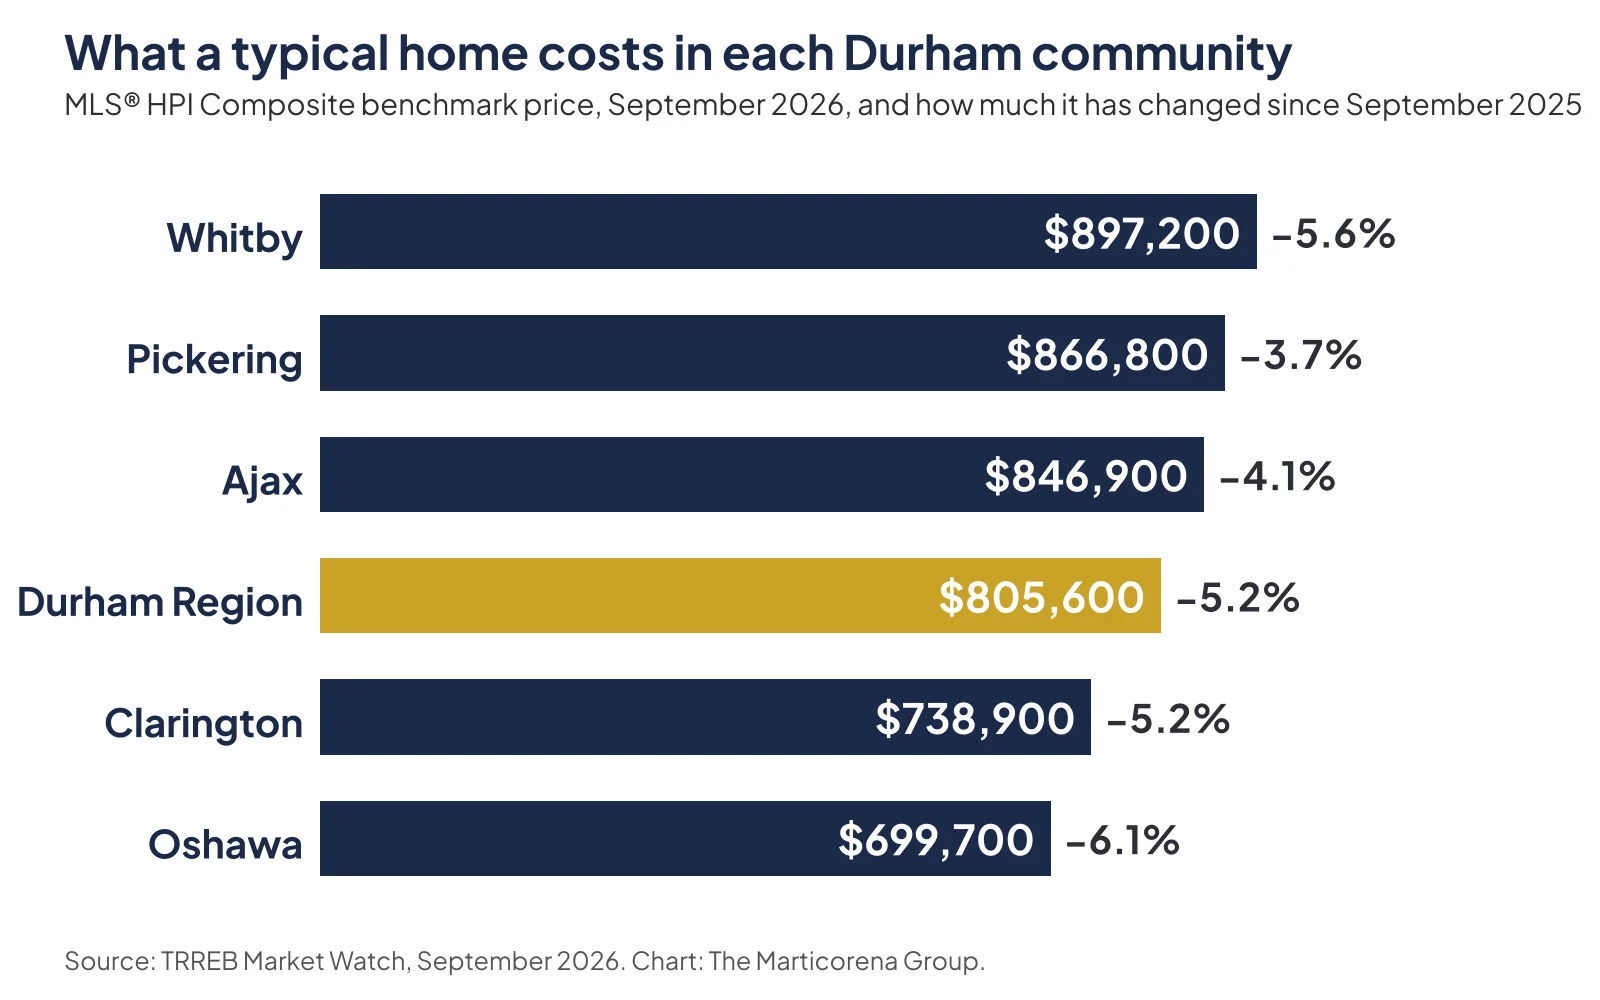
The chart shows prices. The notes below add what the chart cannot: how busy each community was, how much choice buyers have, and what that means if you are buying or selling there. Each “TMG read” is our interpretation of the evidence, not a TRREB classification.
Pickering
92 homes sold (17% fewer) · 3.7 months of inventory · 50 property days on market
TMG read: slower sales, values holding up best. Pickering’s benchmark price fell 3.7% over the year, the smallest decline of the five. Sales slowed, though, and homes spent longer on the market than a year ago (50 property days on market, up from 44).
If you are buying: Pickering offers among the most choice of Durham’s five larger communities (3.7 months of inventory, the highest of the five), and more time to compare. If you are selling: values have held up comparatively well, but buyers are taking longer, so pricing against today’s competition matters.
Ajax
77 homes sold (24% fewer) · 3.0 months of inventory · 37 property days on market
TMG read: fewer sales, shortest time on the market. Ajax had the shortest market exposure of the five (37 property days on market, down from 46 a year ago), even with a quarter fewer sales.
Its average selling price was 8.3% lower than last September, while its benchmark was 4.1% lower. That is a useful example of the point above. The average can be pulled around by the mix of homes that happened to sell in a month, while the benchmark is designed to track a typical home’s value more consistently. The data does not tell us exactly why the two differ here, only that they measure different things.
If you are buying: choice is limited, and well-presented homes may not wait. If you are selling: the average-price figure on its own is not a measure of how your home’s value has changed.
Whitby
96 homes sold (22% fewer) · 2.9 months of inventory · 47 property days on market
TMG read: the tightest supply in Durham. Sales and new listings both fell by 22%, so demand and new supply shrank together. Whitby has the least choice relative to demand of the five, and homes that sold went for about 99% of asking.
If you are buying: expect fewer options here than elsewhere in Durham. If you are selling: you face less competition from other listings, but the benchmark is still 5.6% below last year, so price for today’s market, not last year’s.
Oshawa
125 homes sold (28% fewer) · 3.6 months of inventory · 50 property days on market
TMG read: the biggest slowdown, and the most homes to choose from. Oshawa still had the most sales in Durham, but the drop from last September was the largest of the five. It also has the most homes for sale (660) and the largest benchmark decline (6.1%).
If you are buying: this is where you have the most options. If you are selling: you have the most competition in the region, so how your home compares with similar listings nearby is what matters most.
Clarington
113 homes sold (12% fewer) · 3.2 months of inventory · 38 property days on market
TMG read: the steadiest sales, and more new listings. Clarington’s sales held up better than anywhere else among the five, and it was Durham’s second busiest community in September. It was also the only one of the five where more homes were listed than last September (362, up 11%).
If you are buying: selection is growing. If you are selling: demand has been steadier here, but more of your neighbours are listing too.
Scugog, Uxbridge and Brock are included in the Durham totals. With 23, 18 and 8 sales, one month is too small a sample to draw conclusions about them.
Not every type of home is moving the same way
A headline like “Durham prices are down about 5%” does not mean every home moved by the same amount. Different types of homes have their own supply and their own buyers.
September showed that clearly:
- Semi-detached homes and freehold townhouses sold at or slightly above asking on average (101% and 100%).
- Condo apartments sold at about 97% of asking, and their average selling price was about 10% lower than last September.
- TRREB’s benchmarks for Durham point the same way: apartments are down 7.7% over the year, detached homes 5.1%.
This is one more reason a regional average cannot tell you what a specific home is worth. It is also one month of data, not a permanent pattern.
What this means for you
If you are buying
More choice relative to demand means more time to compare homes and, potentially, more room to negotiate than buyers had last fall. Oshawa has the most homes for sale; Whitby and Ajax have the least choice.
More choice does not mean every home is negotiable. Homes that are priced and presented well are still selling close to asking.
If you are selling
Buyers are still paying close to asking for homes that sell, but fewer homes are selling than last September, and buyers have more to compare yours with. That makes pricing and presentation more important.
Your real competition is not the Durham average. It is the similar homes for sale in your area, in your price range, right now.
If you own and are staying put
Benchmark values are roughly 4 to 6% below last September across the five larger communities. That is useful context if you are refinancing, renewing a mortgage or thinking about a move.
It is not a valuation of your home. Your street, neighbourhood, home type, condition, renovations and the homes currently for sale nearby all matter more than a regional figure.
Three things TMG is watching
- Whether sales pick up in October. A second slow month would strengthen the evidence that buyers have gained room. A rebound would suggest September was a pause.
- How many homes come up for sale this fall. New listings are still running below last year. If that continues, choice stays limited even with fewer buyers.
- Two local signals. In Clarington, whether new listings keep rising and how sales respond. In Pickering, whether prices keep holding up better than its neighbours’ now that sales have slowed.
We do not know how these will turn out. They are what we will be looking at in next month’s update.
Want to know what this means for your home?
Regional numbers describe hundreds of sales at once. If you would like to understand what September’s market means for your own home, or for a purchase you are considering in a particular Durham neighbourhood or price range, I am happy to look at the specifics with you. No obligation.
Julie Marticorena, REALTOR®
The Marticorena Group, LPT Realty, Brokerage
julie@themarticorenagroup.com · (416) 526-3786 · https://themarticorenagroup.ca
Browse all Durham Region market updates in the Market Updates archive.
About the data
Source. Toronto Regional Real Estate Board (TRREB) Market Watch Full Reports for September 2026 and September 2025, covering MLS® System transactions in Durham Region.
Comparisons. Year-over-year changes in sales, listings and average price are calculated by The Marticorena Group from the figures as originally published. They are not seasonally adjusted. TRREB has since revised some historical data, so comparisons against its revised history may differ slightly. Benchmark prices and their year-over-year changes are TRREB’s own figures.
Months of inventory is TRREB’s trend measure.
Days on market. Community figures are TRREB’s average property days on market (PDOM). TRREB also publishes listing days on market (LDOM). Neither is necessarily a property’s complete marketing history.
TMG read is our interpretation of the combined evidence for each community, not a TRREB classification. Interpretation and commentary are the opinion of The Marticorena Group and are not a guarantee of future market performance.


